
IT automation performance insights with OpenCensus and Google Cloud StackDriver
Overview
Wouldn’t it be great if you can easily identify the bottleneck in your application, or processes? Even better, be alerted when there is a change in the baseline performance?
This article will demonstrate how you can achieve this, using OpenCensus and StackDriver tracing within Google Cloud.
What is a trace?
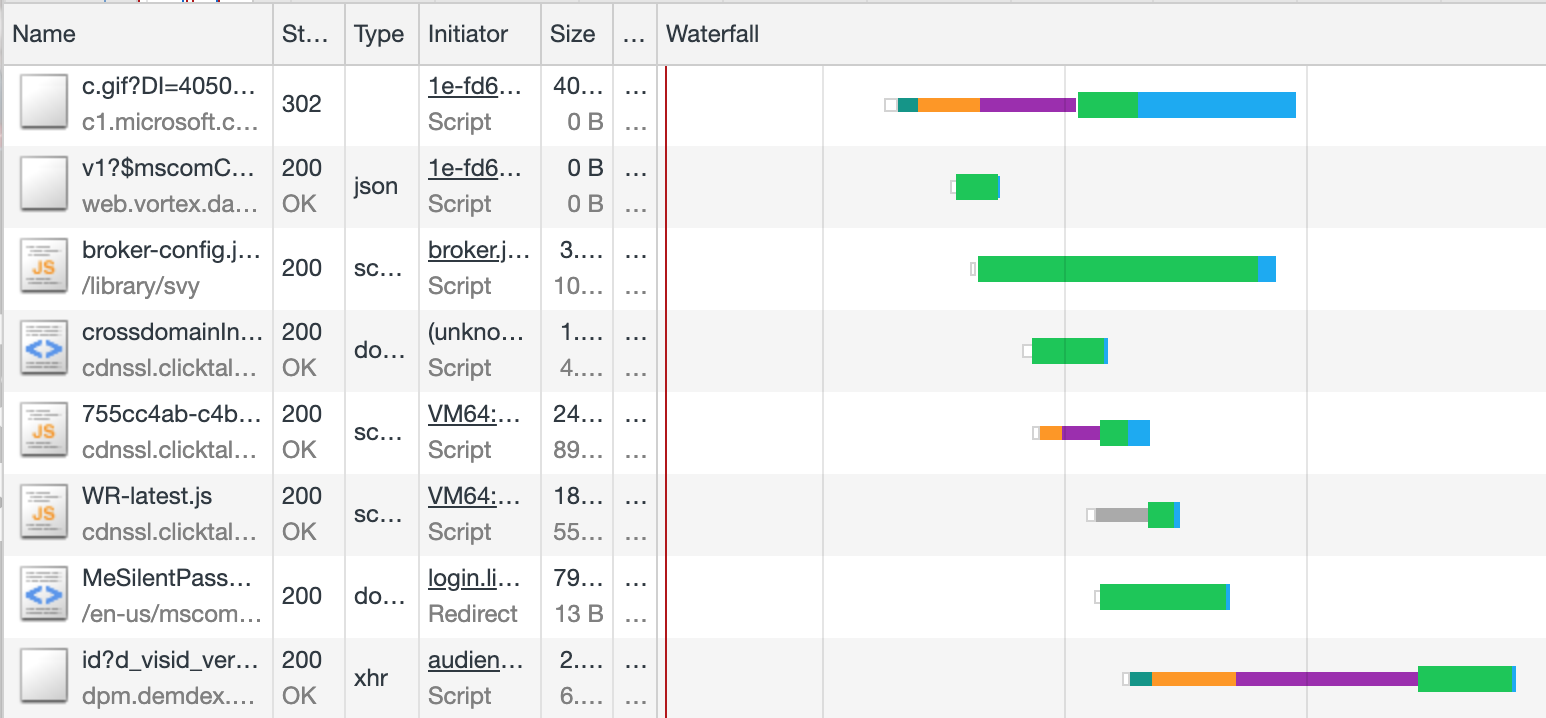
A trace is a dataset which describes how a request flows through the various components of a system. It typically includes data such as processing time (latency) at various stages. A waterfall view can be used to visualize processing times, similar to that provided by developer tools within a web browser like Google Chrome, but using a different source of data.
The waterfall chart in Chrome developer tools is visually similar
What components are involved in tracing?
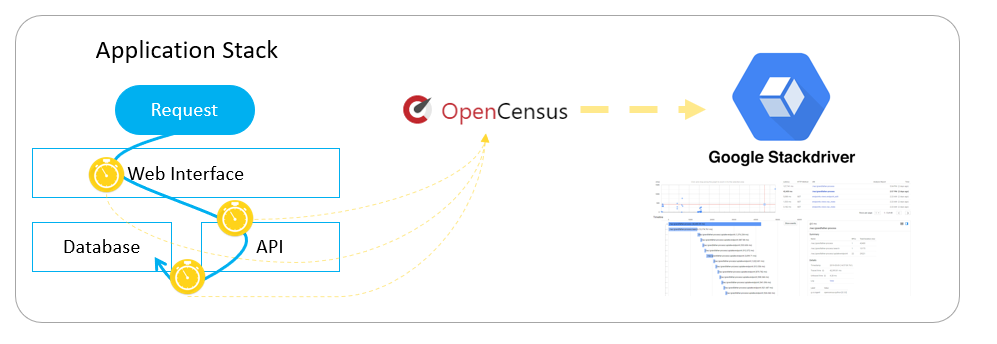
Tracing is typically enabled by within the source code of an application, or activated via middleware. A popular tracing library is OpenCensus which originated from a Google internal library called Census. OpenCensus integrates with various programming langauges and includes the ability to export traces to various external systems including Google StackDriver, Prometheus, SignalFx and Zipkin.
Sample architecture diagram for tracing
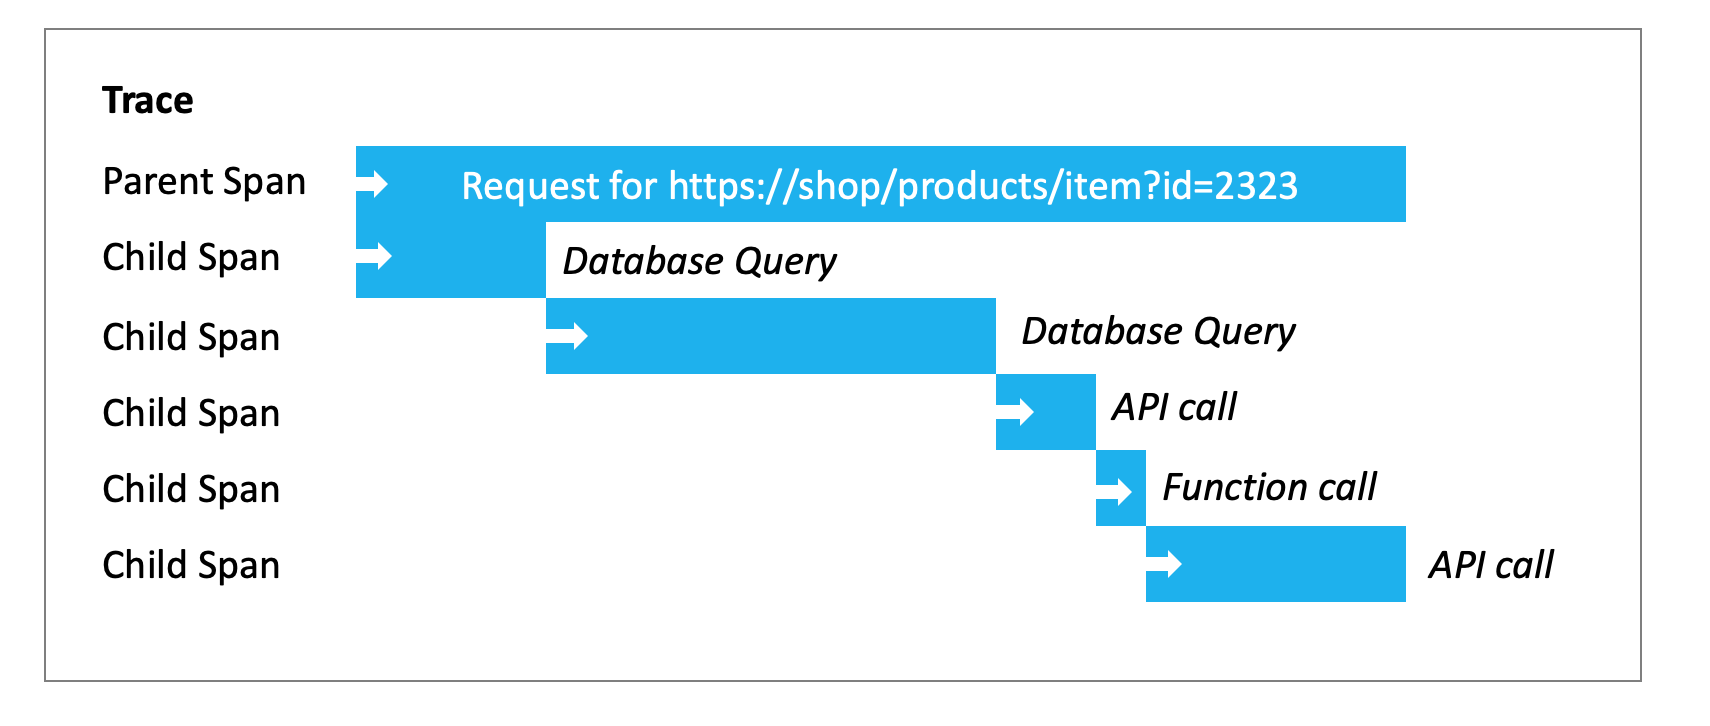
A trace represents a single request as it flows through a system, it includes one parent span, and optionally one or more child spans. A span represents a measurement of one or more operations in a trace, for example an operation (span) could encompass a database query, HTTP request to an API, or function within the source code.
Example trace for a web request, which includes multiple spans for various operations
Enabling traces for IT automation processes
I frequently develop software solutions to automate IT processes in the domain of computer networking. This led to me explore how I can gain visibility into the performance and reliability of automation.
A typical automation process may involve the several operations, for example:
- Retrieving data from a master data source
- Retrieving data from an IT system
- Comparing data in both systems
- Performing multiple create/read/update/delete (CRUD) operations in an IT system
- Generating a report of changes
The following section demonstrates how to enabling tracing within a simple Python script, including exporting traces to StackDriver in Google Cloud.
Prerequisites
The following items are required to implement the solution:
- Google Cloud project, with service account (Cloud Trace Agent IAM role assigned)
- Python libaries for OpenCensus, including exporter for StackDriver
- Source code (the process we’ll enable traces within)
Google Cloud Project and service account
The Google Cloud project is used to store and visualize trace data sent by the OpenCensus libraries. You can sign up for a personal Google Cloud account, which includes a free credit. Create a service account and assign the ‘Cloud Trace Agent’ Identity and Access Management (IAM) role. Create and download a key; this JSON file will be used by OpenCensus to authenticate to the Google Cloud project. Refer to document Getting Started with Authentication for more information about authenticating to Google Cloud.
Python libaries for OpenCensus
Download the Python libraries using PIP:
pip install opencensus
pip install opencensus-ext-stackdriver
Sample source code
Below is an example of how OpenCensus has been integrated into an existing script. A key point is that any code nested under with tracer.span(name="name of span") as span: will contribute to an instance of a span measurement. As the code is processed by the Python interpreter, the first span will be the parent, any further instances will be considered as additional child spans. The name of the span is arbitrary, but I chose to use a URI convention to illustrate the structure/flow of the automation process.
Annotations can be added to spans, enabling additional context when viewing the waterfall chart.
span.add_annotation("processing item {}".format(item))
Labels can be create to provide more information when viewing the details of a span.
tracer.add_attribute_to_current_span(attribute_key='Operation', attribute_value='Delete')
Sample Python script with traces enabled
# import OpenCensus modules
from opencensus.common.transports.async_ import AsyncTransport
from opencensus.ext.stackdriver import trace_exporter as stackdriver_exporter
from opencensus.trace import tracer as tracer_module


def get_master_data():
    # create the first child span, everything executing within the function is measured
    with tracer.span(name="/it-process/get-master-data") as span:
        data = some_function_to_get_master_data()
    return data

def get_it_system_data():
    # create the second child span
    with tracer.span(name="/it-process/get-it-system-data") as span:
        data = some_function_to_get_it_system_data()
    return data

def sync_data(master_data, it_system_data):
    results = []
    for item in data:

        # create the third child span for each item
        # everything executed in the block below is measured
        with tracer.span(name="/it-process/sync-data") as span:
            response = some_function_to_sync_data()
            results.append(response)

            # let's create an annotation showing what item is being processed
            span.add_annotation("processing item {}".format(item))
    return results

def generate_report(results):
    # creates fourth child span
    with tracer.span(name="/it-process/generate-report") as span:
        report = some_function_to_generate_report(item)

        # let's add some additional information about the span
        tracer.add_attribute_to_current_span(attribute_key='Total Report Items',
                                             attribute_value=len(report))
    return report


if __name__ == '__main__':

    # setup the OpenCensus trace and exporter
    exporter = stackdriver_exporter.StackdriverExporter(project_id='my-google-project-id',
                                                        transport=AsyncTransport)
    tracer = tracer_module.Tracer(exporter=exporter)

    # create a parent span, everything which executes below this is included in the span
    with tracer.span(name="/it-process") as span:
        master_data = get_master_data()
        it_system_data = get_it_system_data()
        results = sync_data(master_data, it_system_data)
        generate_report(results)
Google Cloud StackDriver Trace
Waterfall chart
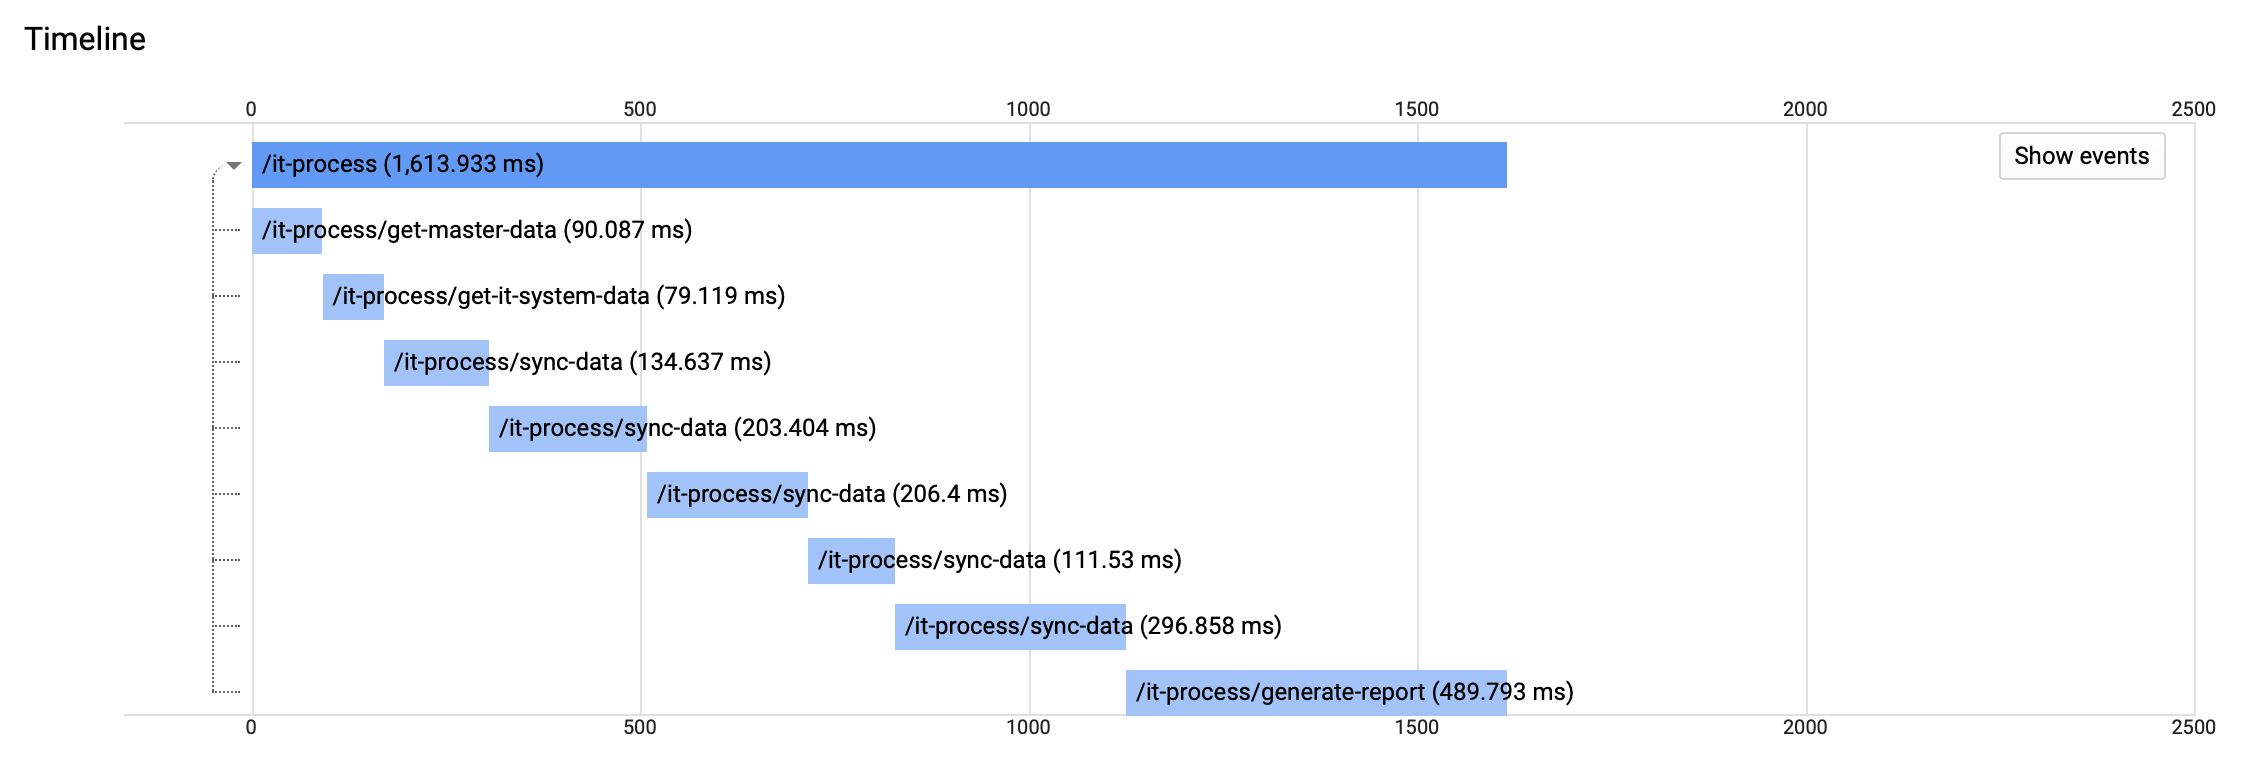
After executing the script the trace will immediately be visible in the StackDriver Trace section of Google Cloud. As you can see, the parent span is named ‘it-process’, followed by child spans of ‘it-process/get-master-data’, ‘it-process/get-it-system-data’ etc.
Chart highlighting each operation in the script, with processing times
Scatter graph
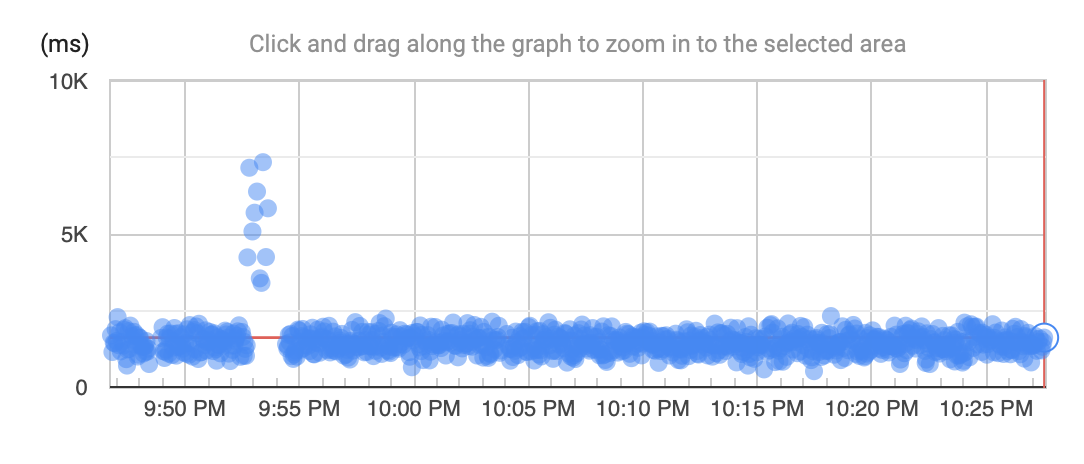
The scatter graph is useful for spotting outliers, where an operation has taken a longer than usual time to process. In the graph there is clearly an issue at 9.54pm. Selecting a data point will display the waterfall chart, along with the operation which introduced the delay.
Scatter graph showing requests by response time
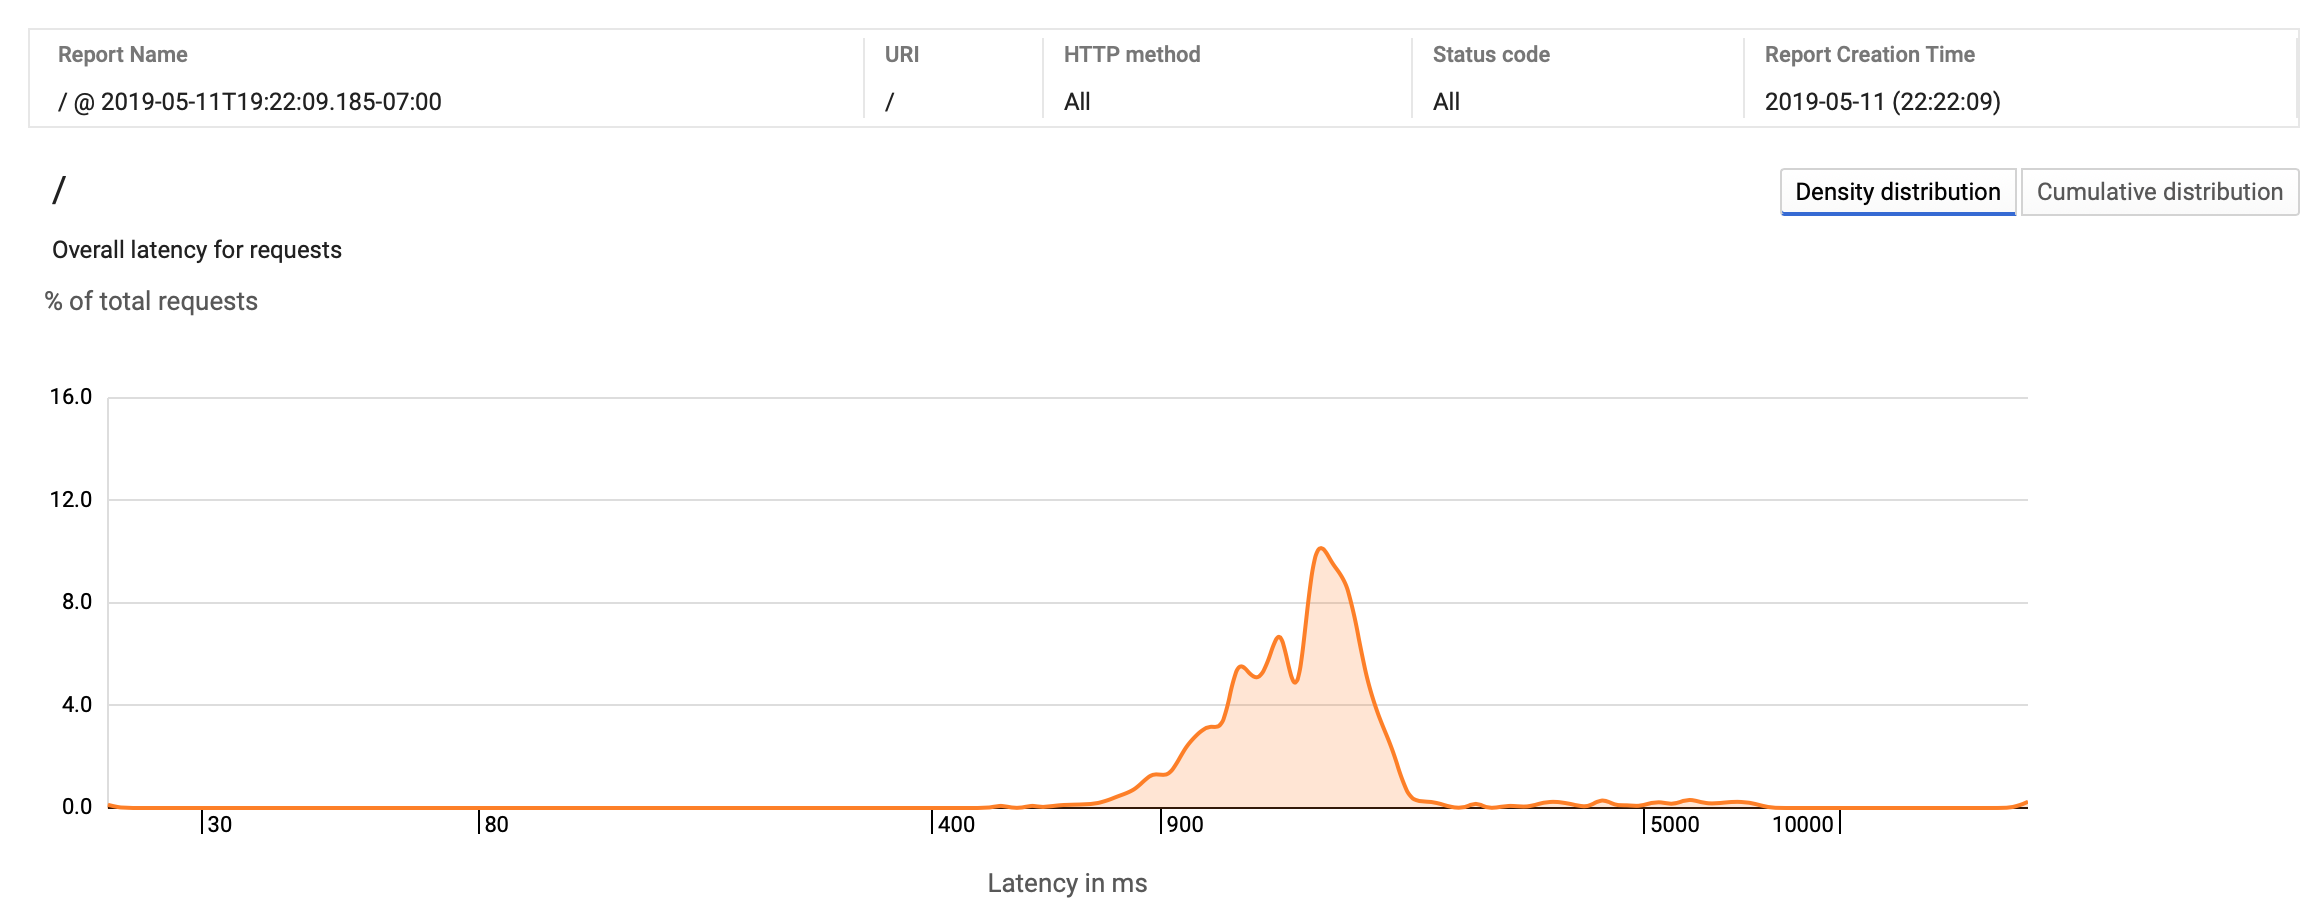
Analysis Report
You can create customized reports to gain insights into trace data, for example viewing percentage of traces by distribution of response time.
Screenshot of custom trace analysis report
I hope this article was useful and provided some ideas for how you could leverage traces to get insights into your processes and applications.